Correlation
This page describes how the business Object model can be used to record the information to support correlations.
Correlations in general
The information about any type of Correlation that needs to be captured is:
- The type of the Correlation, for example:
Pearson’s Product-Moment Coefficient for linear Correlation between two variables
Spearman’s Rank Coefficient for non-linear Correlation between two variables
- Correlation matrix between several variables
- The below matrix is always symmetric, and the diagonal will be always equal to 1. This matrix shows the Correlation coefficients, which are coming from all combinations between N number of variables x
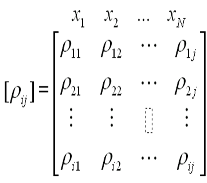
- Covariance matrix between several Variables
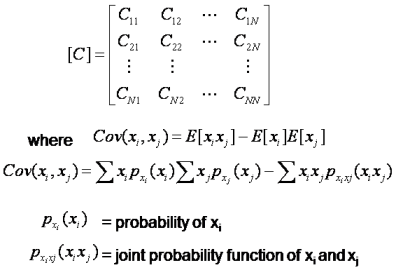
The covariance of itself is the variance of the x_i random variable in the term, then the diagonal of the covariance matrix will have the variances of each random variable
- Gaussian Copula function between several variables
- This is a methodology to model a joint probability density function (PDF) using the marginal probability density functions of each variable. It will have inputs of the Correlation coefficients.
The Variables that the Correlation relates to.
The input data (if any) used to compute the Correlation and how the correlation was computed (i.e. by who, using which methods and tools.
Any assumptions that were made, e.g. if the Correlation was not computed from data but was entered as a value using some assumptions.
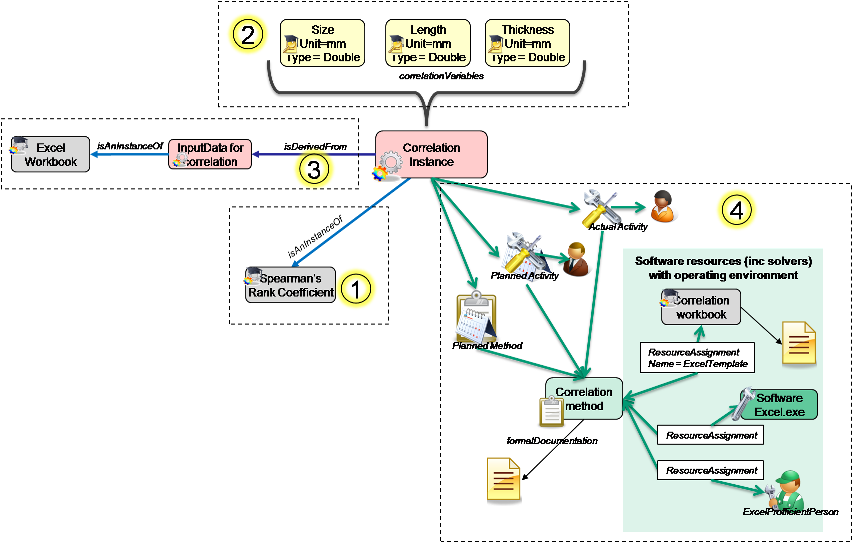
Most of these are already available in a ModelInstance (see SysML - Associative Model Network), the only addition needed is to relate to the variables. So it is logical therefore to make a CorrelationInstance a specialisation of ModelInstance and add a relationship to KeyValueType. So the information is a follows:
Type: from ModelInstance it gets “+isAnInstanceOf:ModelType”
Variables: new relationship “+correlationVariable:KeyvalueType”
- Input data: from ModelInstance it gets
- the derivedFrom classes to other ModelInstances and KeyValueInstances.
- assigned actors in various roles.
- preferred, planned and actual methods and tools used.
Assumptions: from ModelInstance it is allowed to have Assumptions (and Justifications).
The common information for correlations
The Type of the Correlation is very important because it is here that the type of results data is defined. For example, for a simple Correlation coefficient, the only a single property would be needed. Another type of Correlation coefficient may need properties for the variance as well as the coefficient. A Correlation matrix may have a series of properties or declare an XML format, or other file format for storing the matrix. Copula correlations may have different results formats again. This is not shown in the image above.
In addition to defining the format of the results data the type definition can provide further information such as, for coefficients declaring which type (e.g. Pearson, Spearman, Kendall tau), and suitable methods.
For more details on this example see: Very Simple Example
Correlation between two variables
As large a sample as possible it needed to compute a reliable Correlation. Therefore the sample data is most likely to be stored in a data file which is then used to compute the correlation. In order to maintain the traceability, that data file itself should be a model instance, with information about where it come from and how it was computed. This is the scenario illustrated above.
Example using Business Object Model Classes
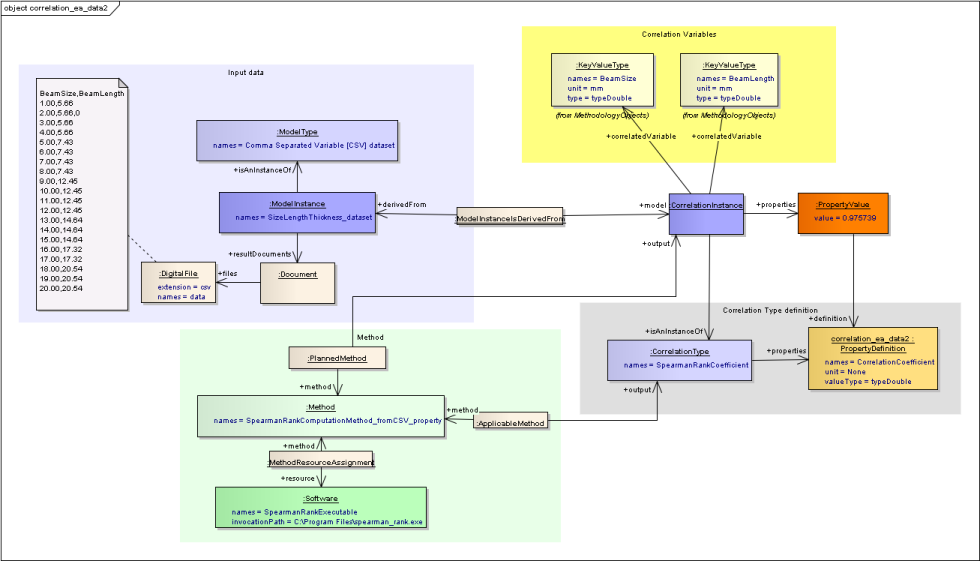
The image below uses the same scenario as above but shows how it is represented using classes from the Business Object Model.
- The Correlation is a “SpearmanRankCoefficient” (grey box). This declares that is just needs a single coefficient property (pale orange) to be computed. This then appears as a PropertyValue (dark orange) which has the value filled in after computation.
- The two variables are the BeamSize and BeamLength KeyValueTypes (yellow box)
- The input data (blue box) is stored in a csv (comma separated variable) file, and it is not shown where this comes from.
- Then the planned method (green box) is a method that uses a software tool (spearman_rank.exe) to compute the Correlation.
Data file as input to a coefficient
For more details on this example see: Very Simple Example
However it could be that the input values are computed individually and need traceability for each one (e.g. extracted at different points in a collaborative process). In this case each value needs to be a KeyValueInstance and linked to the other of the pair, and then the pairs become inputs to the CorrelationInstance.
Example using Business Object Model Classes
The image below uses the same scenario as above but shows how it is represented using classes from the Business Object Model.
- The Correlation is a “SpearmanRankCoefficient” (grey box). This is exactly the same type as used in the data file example above and declares that is just needs a single coefficient property (pale orange) to be computed. This then appears as a PropertyValue (dark orange) which has the value filled in after computation.
- The two variables are the BeamSize and BeamLength KeyValueTypes (yellow box)
- The input data (blue box) a set of KeyValueInstances of the type KeyValueTypes. These are then paired and the pairs are each an input to the Correlation Instance.
- Then the planned method (green box) is a method that uses a software tool (spearman_rank.exe) to compute the Correlation.
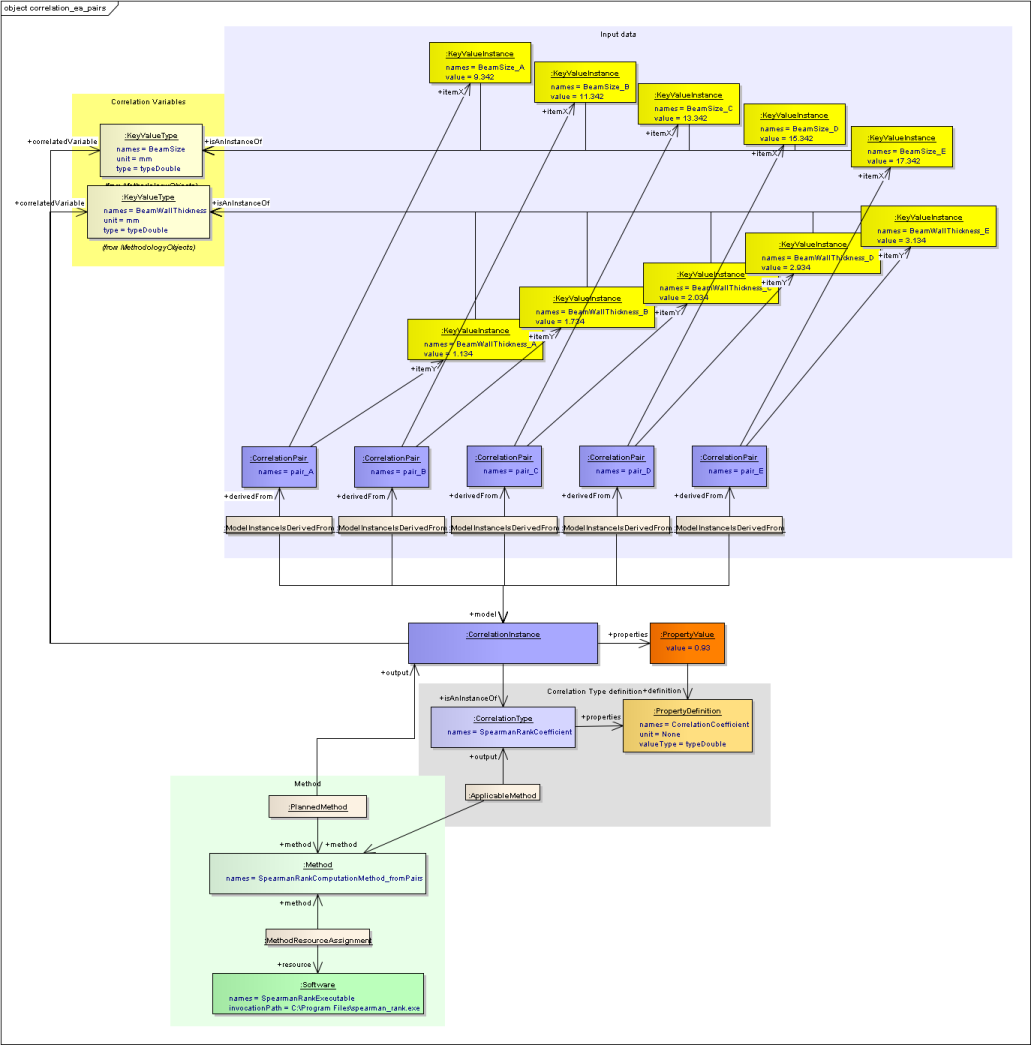
Paired data as input to a coefficient
In reality this is only usable for small set of data, and for correlations between two variables.
Other scenarios would result in an explosion of data
For more details on this example see: Very Simple Example
Correlations between more than two variables
The examples shown so far have been to compute a Correlation coefficient between two variables. The difference in the information that is stored for a multiple variable correlation is that more than two KeyValueTypes are linked to the CorrelationInstance, and the format of the results data is likely to be a document rather than properties.
Example using Business Object Model Classes
The image below is a slight variation on the earlier example with a datafile as input. In this case the input file (blue box) has three columns of data, it uses a different method (green box) though the same software tool. The type (grey box) defines the XML format for the results. These results (cyan box) are stored in a digital file attached to the CorrelationInstance.
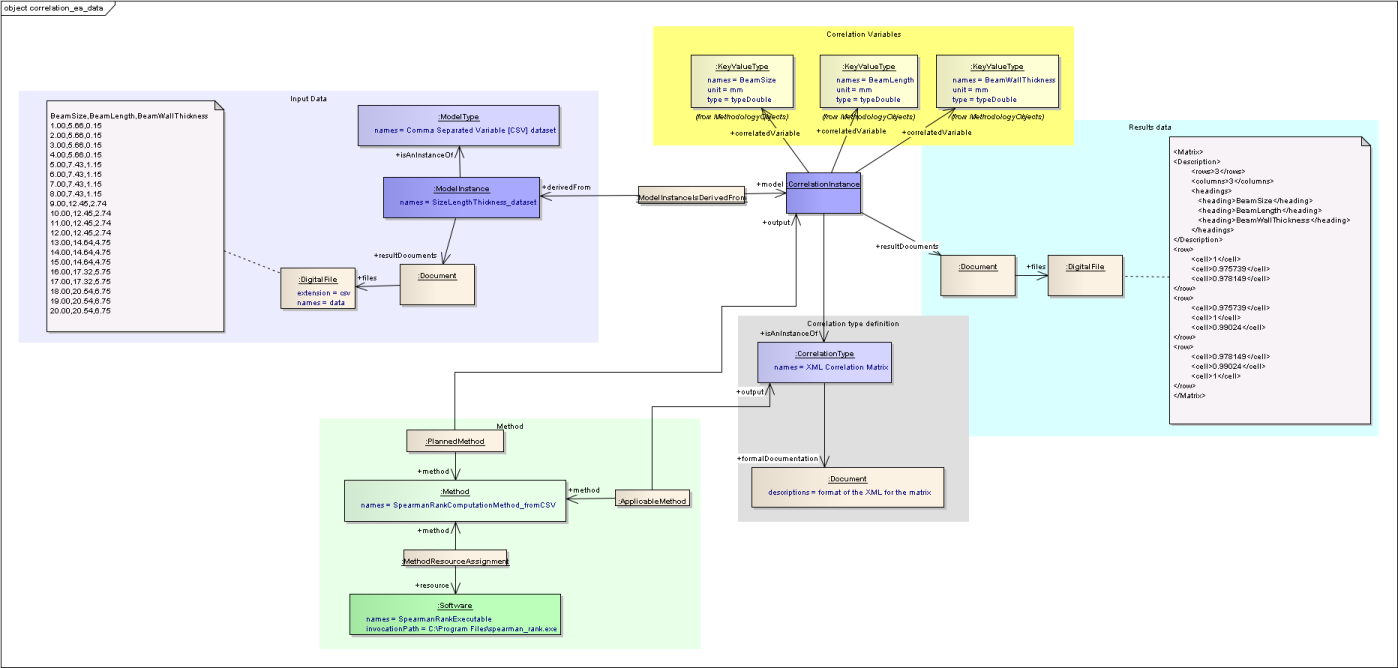
Data file as input to a correlation matrix reported in an XML file
For more details on this example see: Very Simple Example
For more information see SysML - Correlation
Section author: Judith Crockford